
How can I visualise complex ideas with simple forms?

My two cents
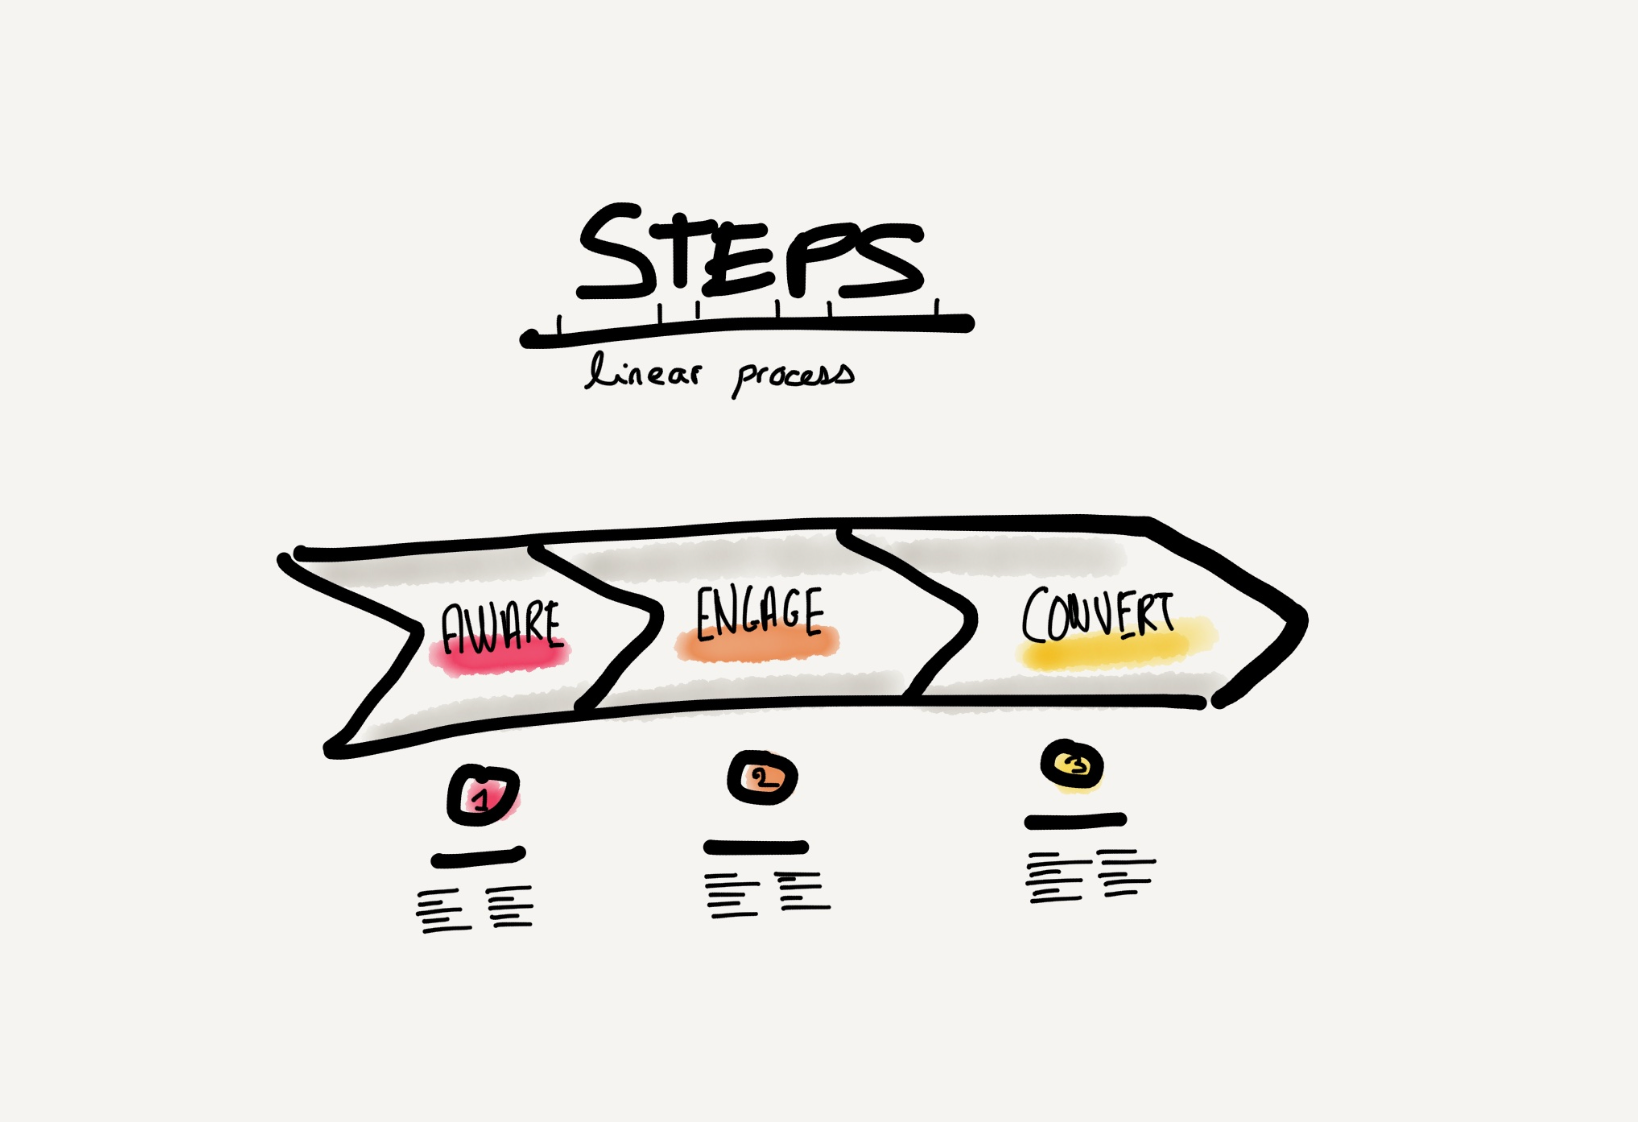
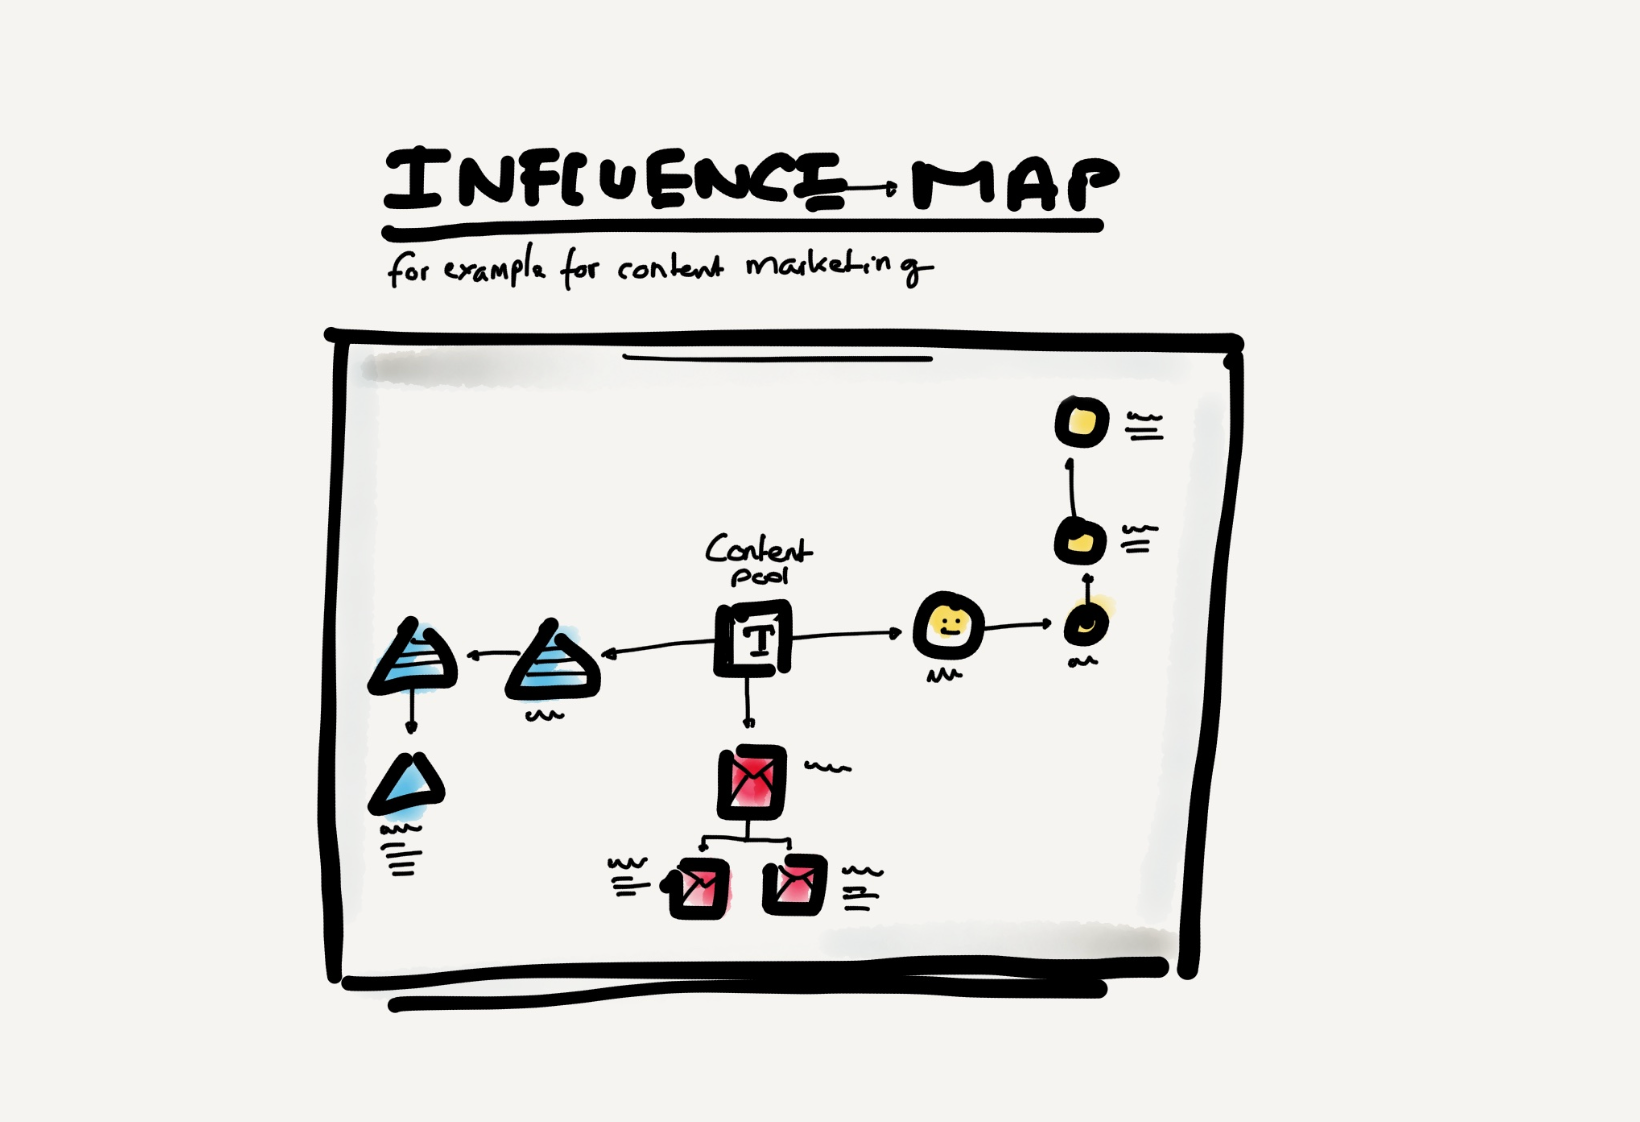
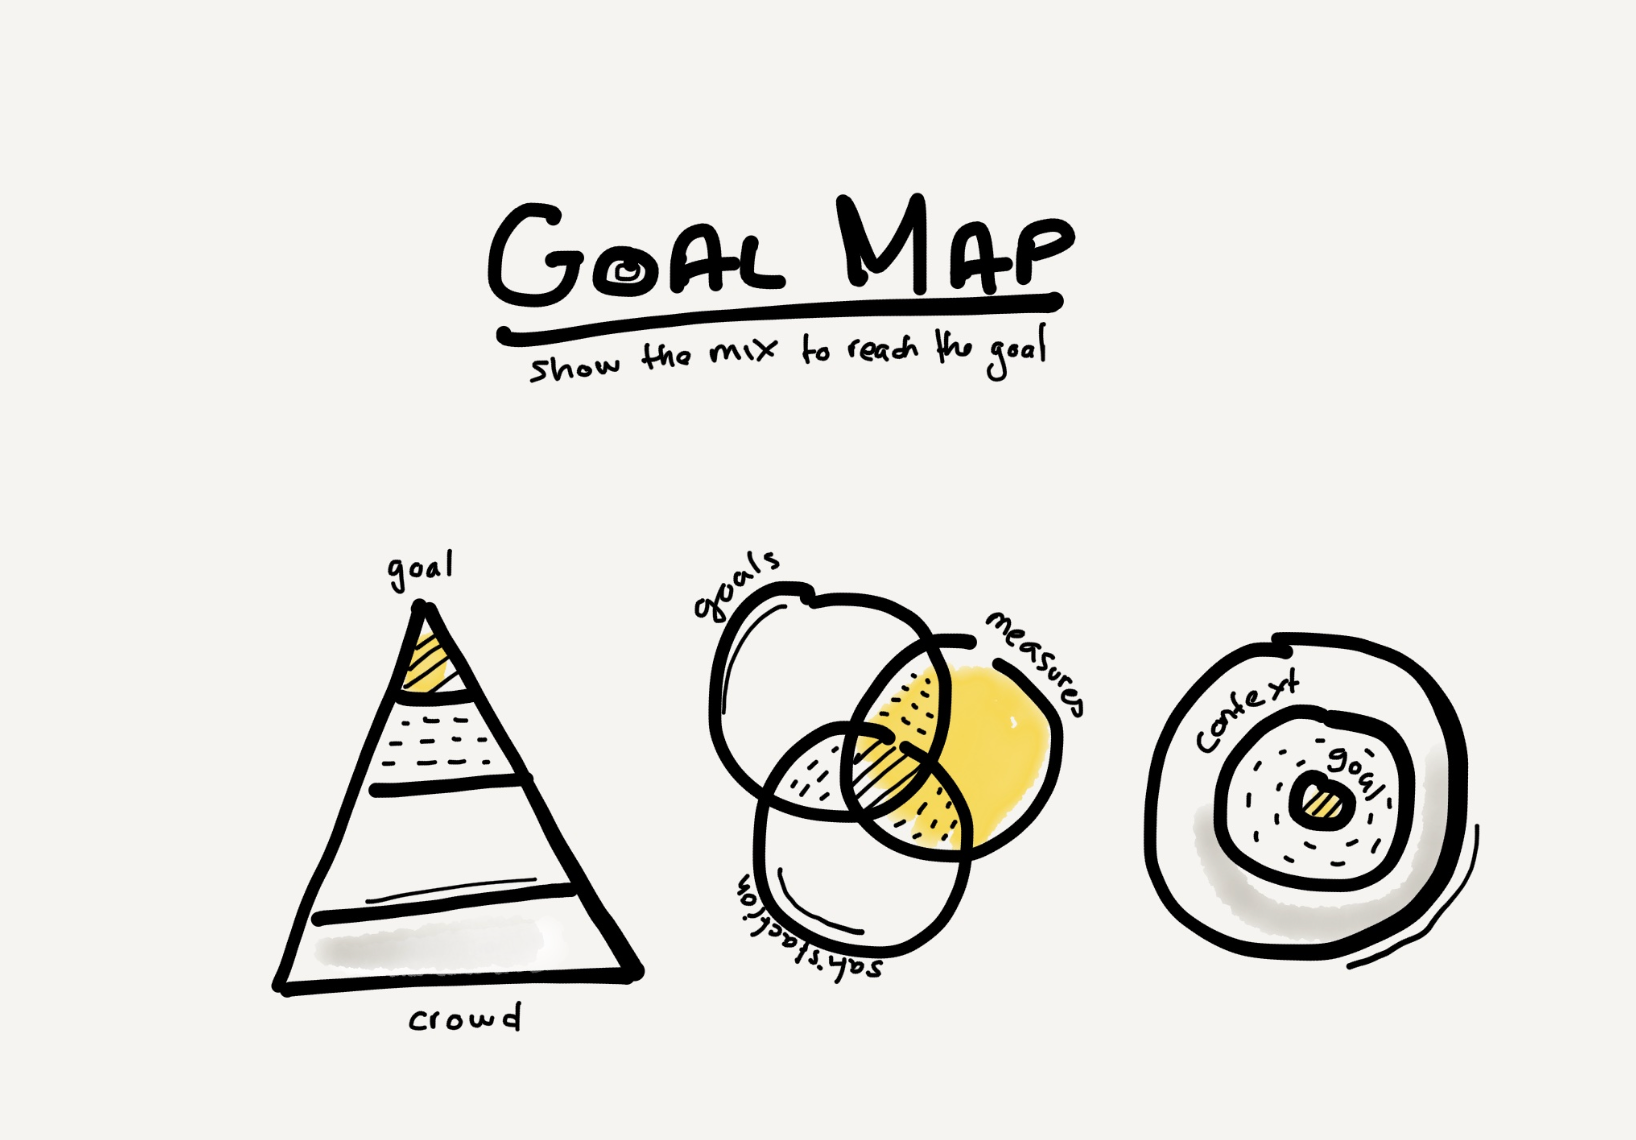
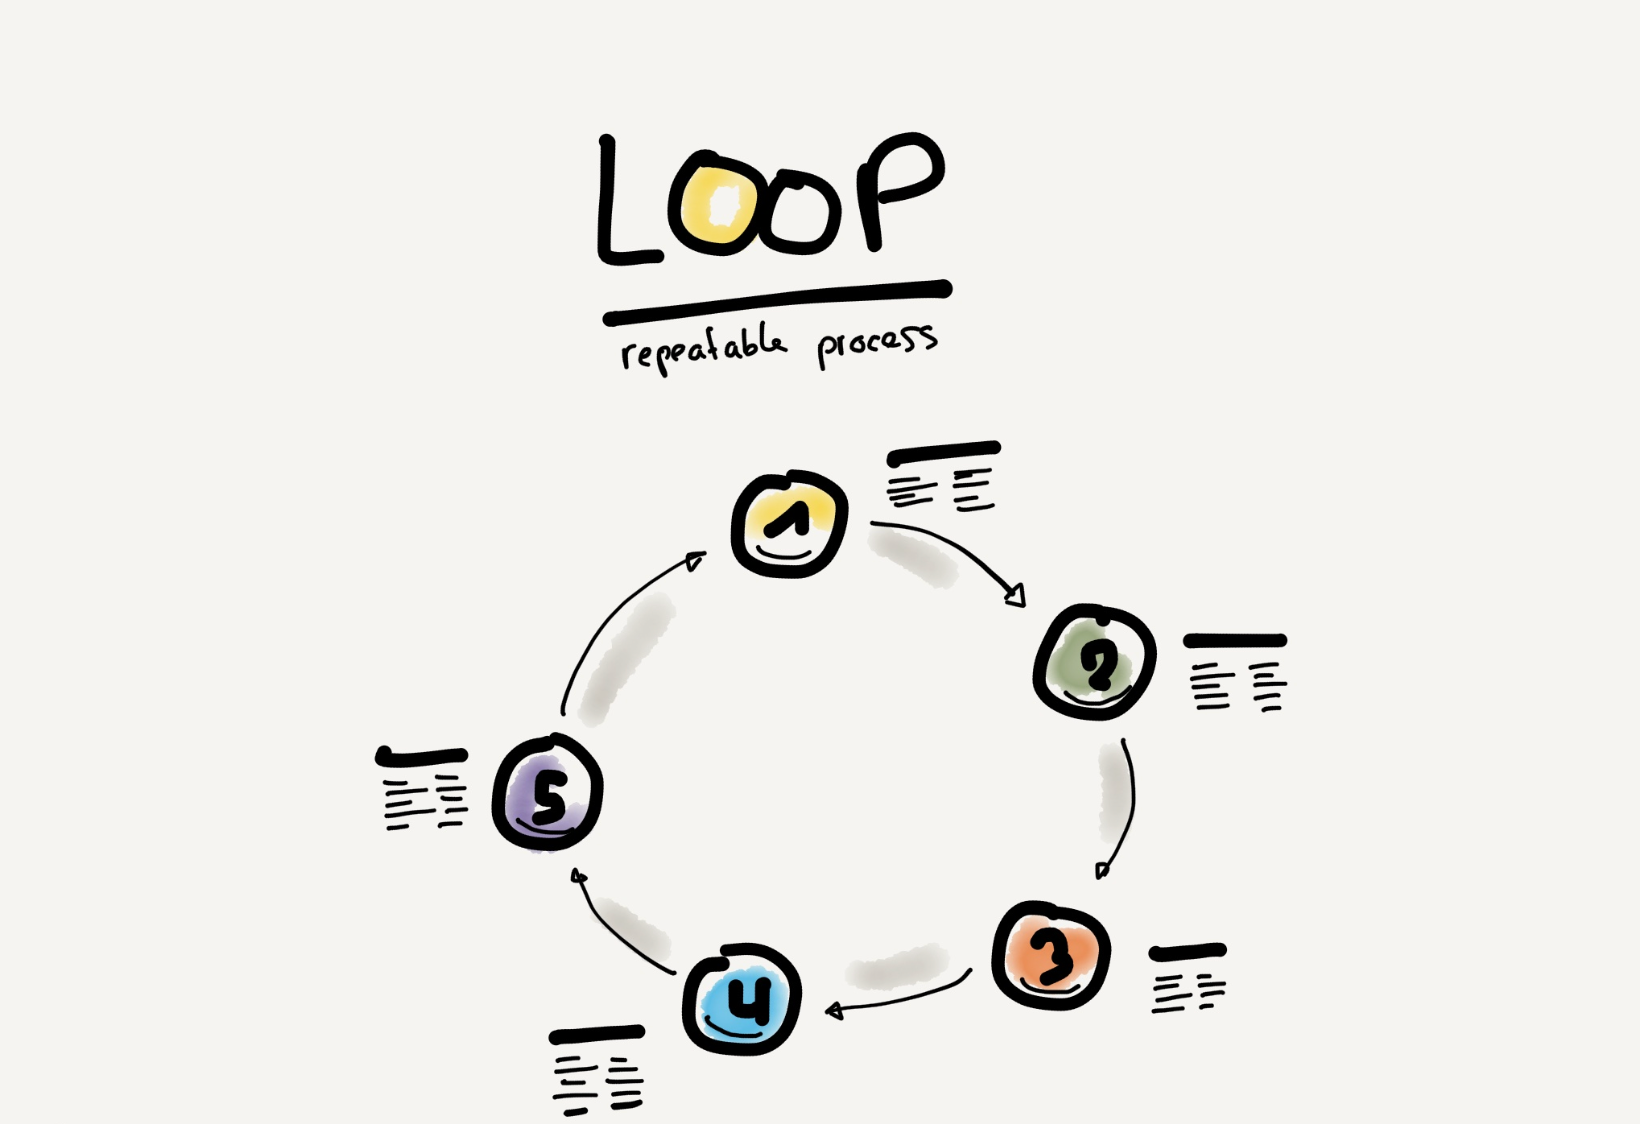
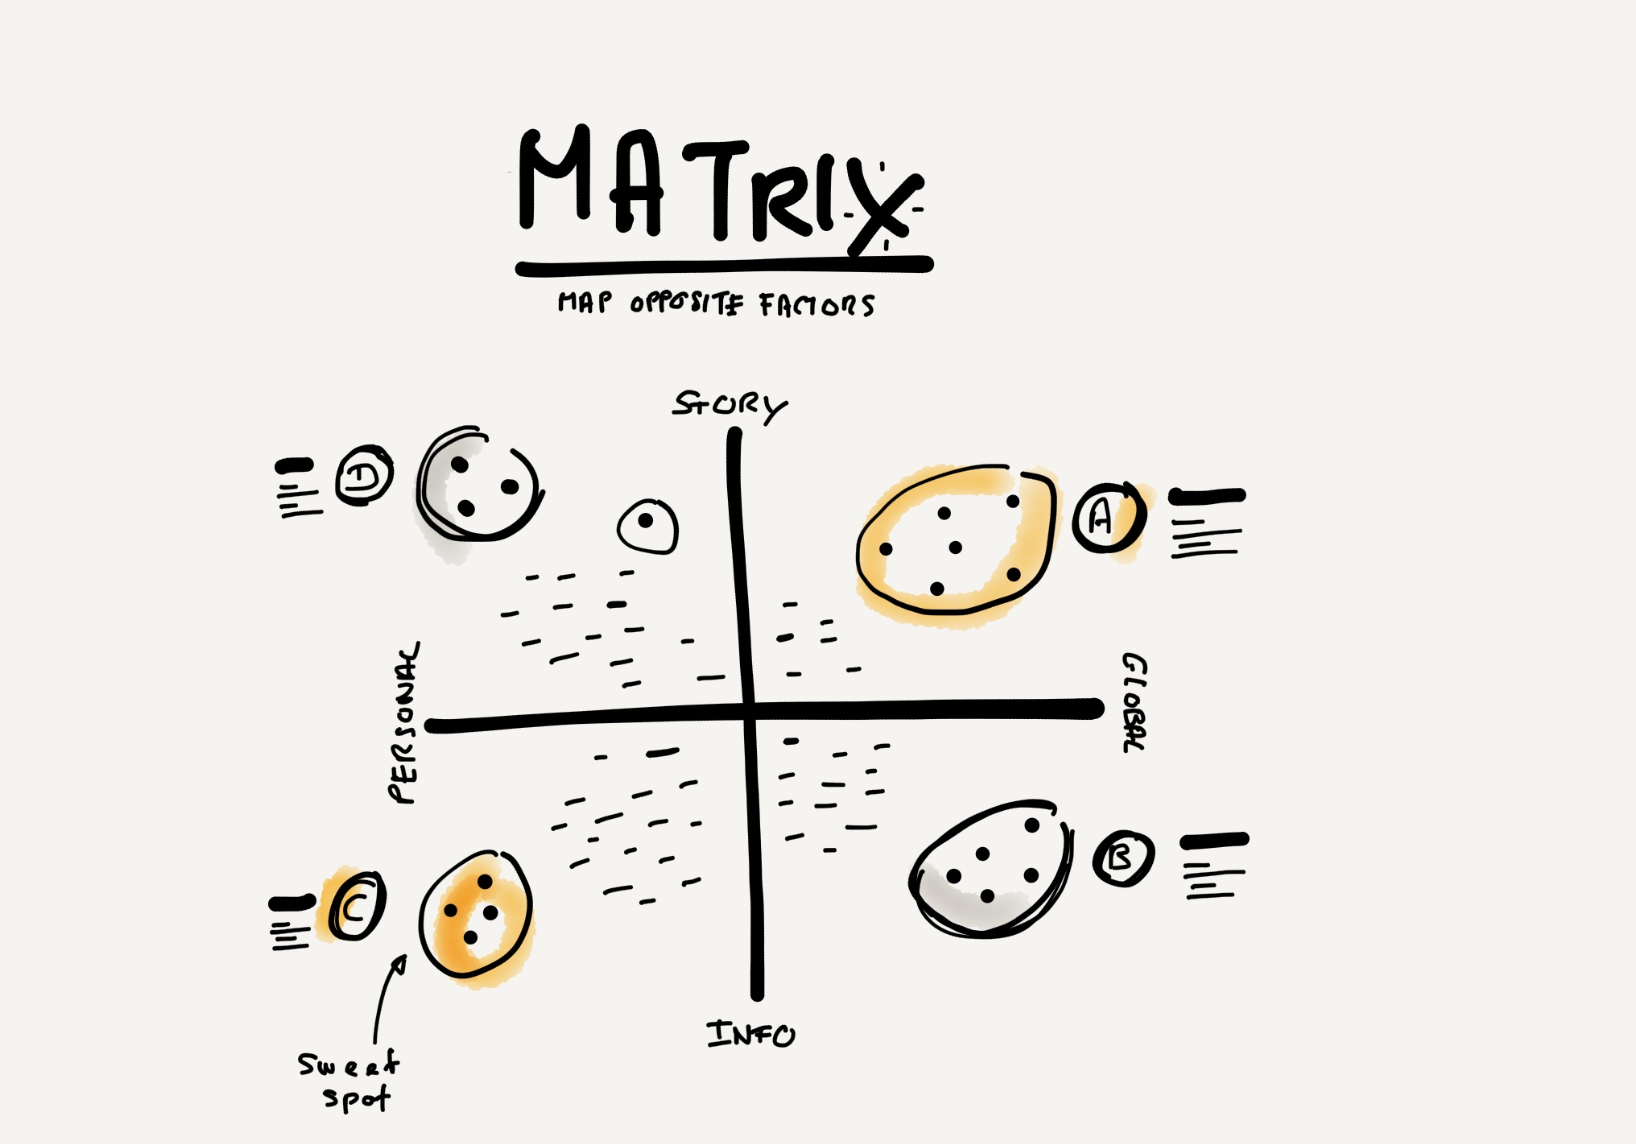
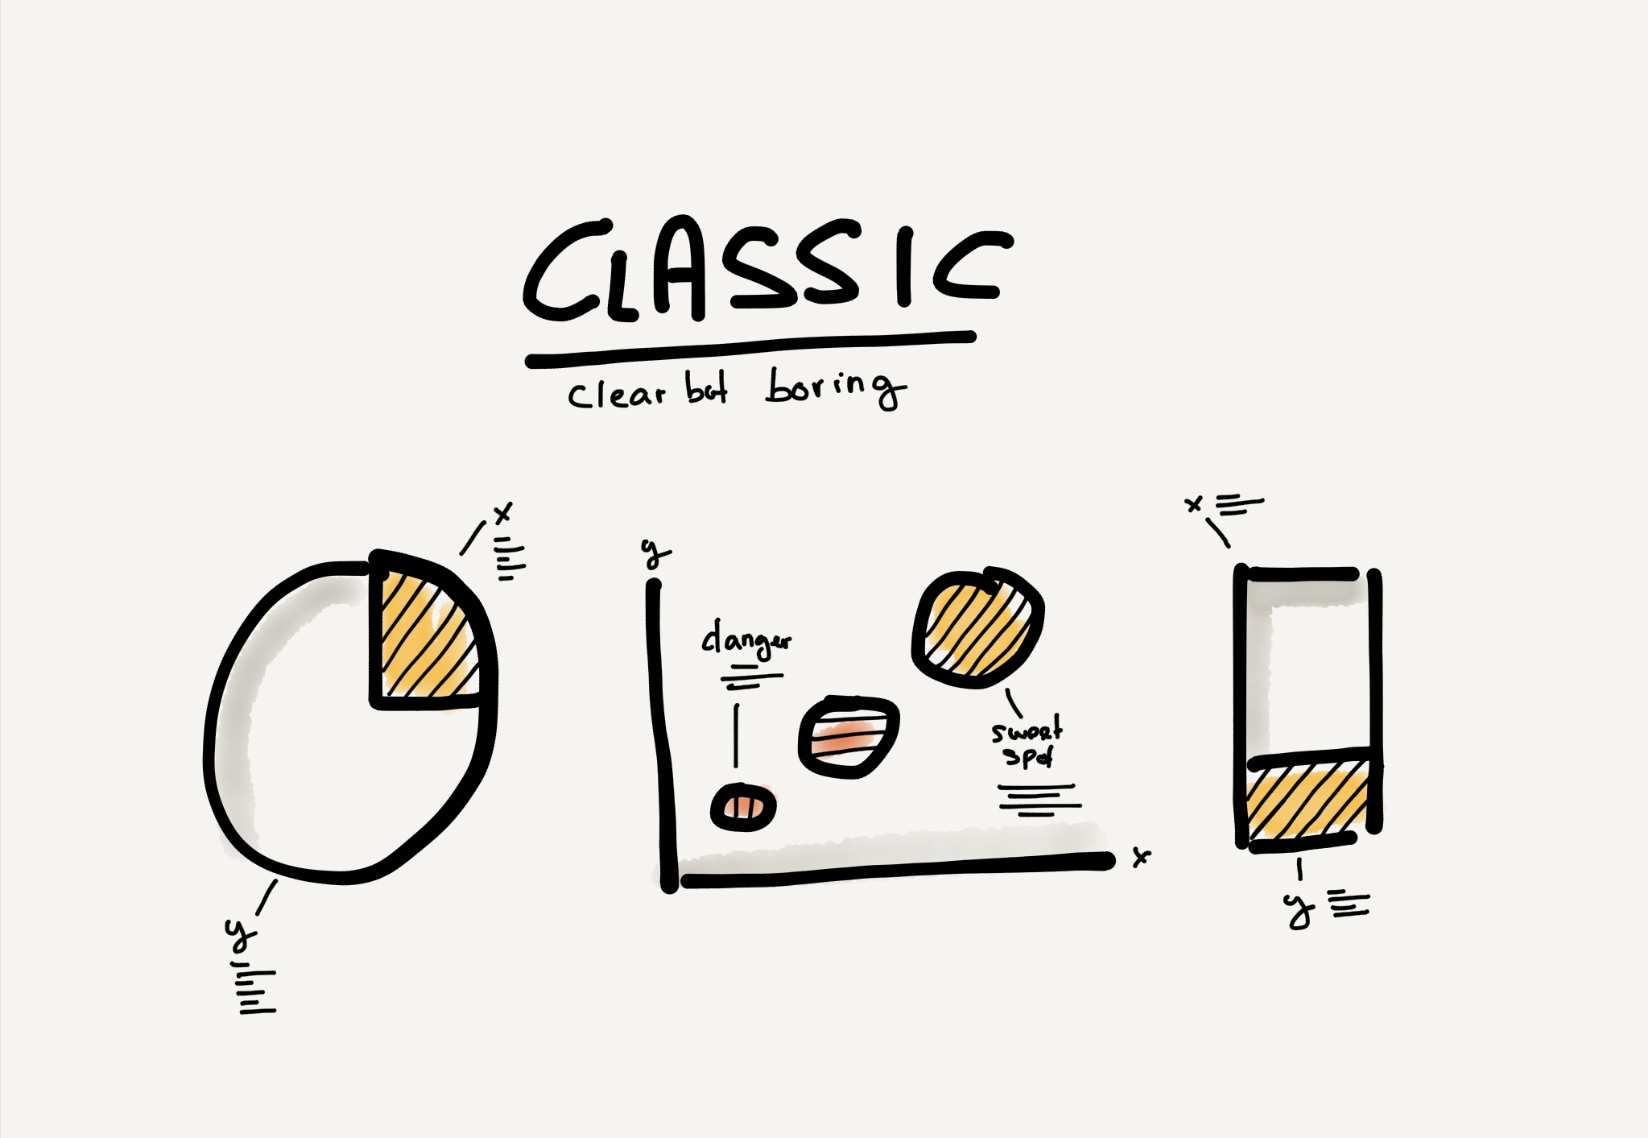
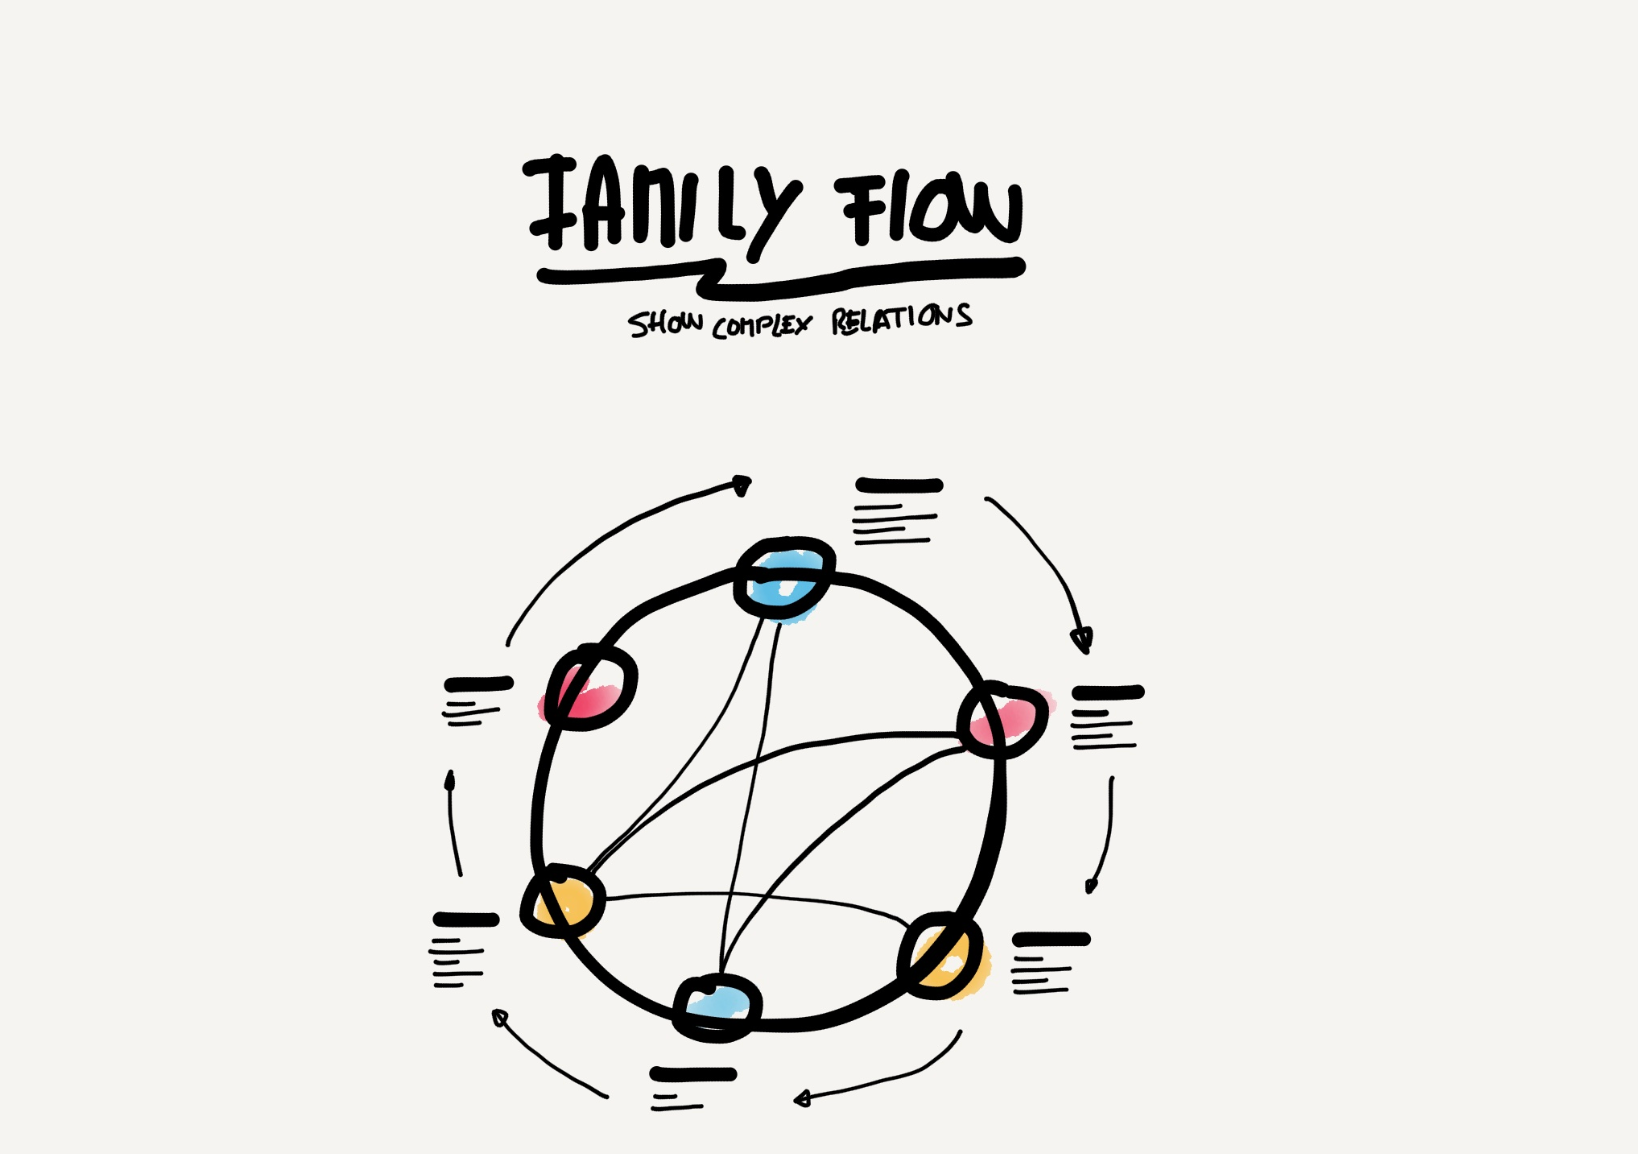
Back in the days when I was working in a marketing agency, I created a collection of 13 visualisations to help my project manager friends imagine how they could visualise complex processes, learnings or strategies with simple shapes:


What the experts say
Obviously there are way more possibilities to do so as you can discover on specialized publications and websites like:
Related articles
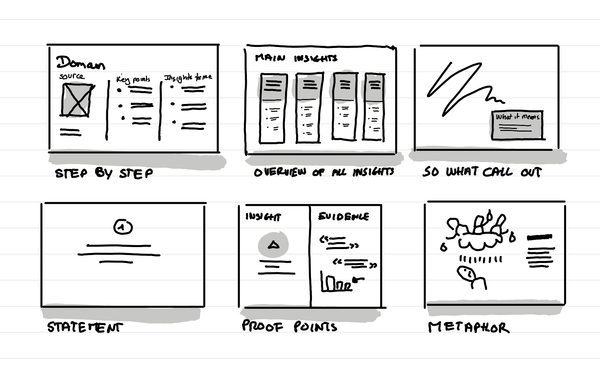
What are strong slides structures to share your synthesis work?
In short: there are many ways to do it. Here 6: step by step, overview of all insights, so what call out, statement, proof points, metaphor.
How do I choose the chart type to show my data?
In short: I mostly use pie charts and bar charts. But if needed you can use the Chart Chooser to help you know which graph to choose.
Why do I make websites for some workshop reports?
In short: It's easy to share and works well on mobile. It's fancier than a deck and can be the start of a communication plan.